Images to Video
BehanBox is covering women-led resistance through interviews, digital artifacts. I created a map of protests across India two weeks ago for an article.
Post that we wanted to explore how the events unfolded from mid-December until now. The result is below series of maps:
 GIF converted from the video
Here, I write about the process of creating it, related experiments.
I used the following toolkit to create the video:
jupyternotebook for interactive scriptingpython,pandas,geopandasfor scripting, geo-data wranglingmatplotlib,pyplotfor plottingffmpegfor video creation – spent good chunk of my time in figuring out right attributes
Geopandas
geopandas is a smart addition to one’s workflow if dealing with geo-data (ex: addresses or latitude/longitude). One can read an excel/csv file with location attributes and convert it to a geometrical dataframe.
import geopandas
# df is a dataframe where each row has a latitude, longitude for a given data point
gdf = geopandas.GeoDataFrame(
    df, geometry=geopandas.points_from_xy(df.Longitude, df.Latitude))

# loop through each item and plot as a point
for d, m in gdf.groupby(['Date']):
    m.plot(ax=ax, color='navy')
Creating text annotations
matplotlib’s annotate utility is useful to place custom text at arbitrary location on the plot.
# xy refers to the actual position on the map that needs to be annotated
# xytext refers to the position where goes from the text
plt.annotate('Annotation text', xy=(77, 28.5), xytext=(70, 28.5),
    arrowprops=dict(facecolor='black', arrowstyle="->",
                    connectionstyle="arc3")
)
Drawing 14 annotations manually was tedious. I didn’t spend time to automate as it’ll involve non-overlapping labels which is a big problem in itself to deal with. I was content with the manual part.
Video creation
After struggling to find the right attributes for video creation I stumbled on a StackOverflow answer in fixing broken ffmpeg videos.
cat *.png | ffmpeg -f image2pipe -framerate 1 -i - -c:v libx264 -vf format=yuv420p -r 25 sitins.mp4
cat *.pngconcatenates all images in a given directory-framerate 11 frame per second-c:v libx264forH264codec format-r 25is frames per second-vf format=yuv420p,yuvis a color space. without this attribute the video wouldn’t play on Firefox or on mobile browsers. Fromffmpeg’s website
You may need to use -vf format=yuv420p (or the alias -pix_fmt yuv420p) for your output to work in QuickTime and most other players. These players only support the YUV planar color space with 4:2:0 chroma subsampling for H.264 video. Otherwise, depending on your source, ffmpeg may output to a pixel format that may be incompatible with these players.
I wasn’t able to convert the mp4 video to GIF via ImageMagick after it threw below error:
$ convert -quiet -delay 1 out.mp4 out.gif # attempt to convert mp4 video to GIF

convert-im6.q16: DistributedPixelCache '127.0.0.1' @ error/distribute-cache.c/ConnectPixelCacheServer/244.
convert-im6.q16: cache resources exhausted `/tmp/magick-22502x1Et27YsuYN2.pam' @ error/cache.c/OpenPixelCache/3984.
convert-im6.q16: no images defined `out.gif' @ error/convert.c/ConvertImageCommand/3258.
My fallback option was to use the ever reliable CloudConvert which created a flawless GIF.
Ignored experiment
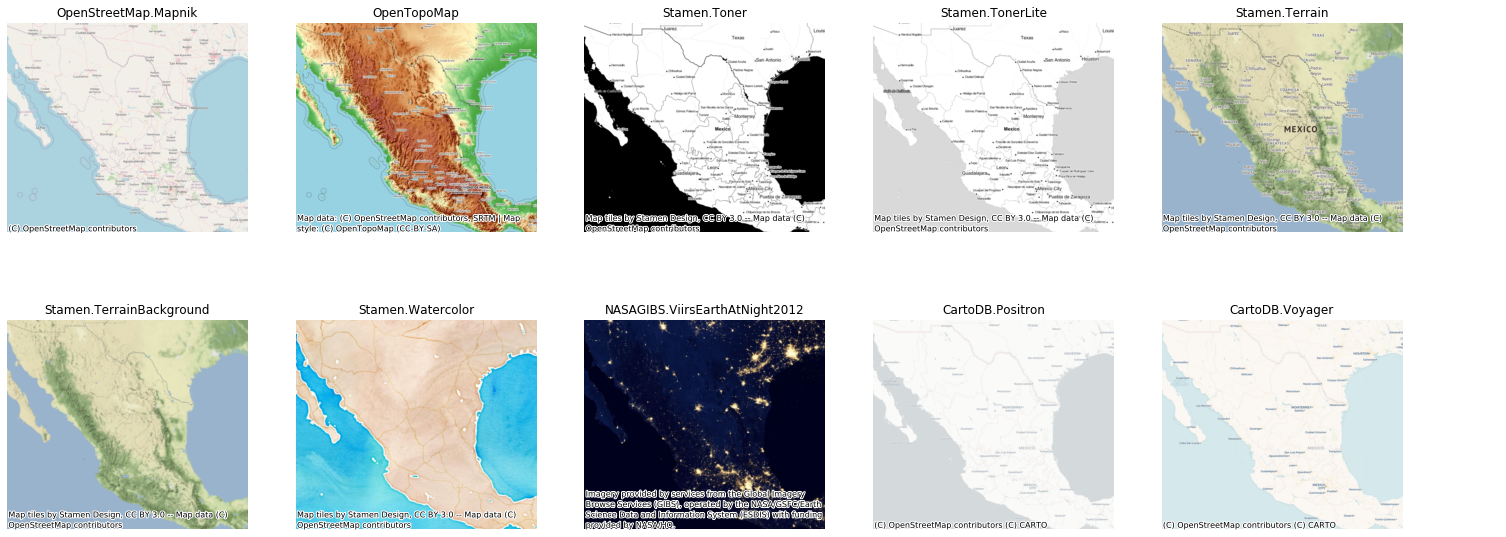
Adding custom tiles to map looked intriguing and I found contextily support in python.
I deal with 4326 coordinate system (CRS) of geometric points in all of my work. Contextily seems to use a different CRS (3395) for adding tiles and so I had to convert the geometrical points to that CRS.
import contextily as ctx
# india is a geopandas object of India geojson shape
india = india.to_crs(epsg=3857)  # transforms to epsg:3857 (elliptical mercator) projection

# adds basemap with Stamen design's Toner Background tile
ctx.add_basemap(ax, url=ctx.providers.Stamen.TonerBackground)

# gdf is a geoDataFrame
# set initial coordinate system
gdf.crs = {'init': 'epsg:4326'} # without this the next step wouldn't work as it needs a base CRS
gdf = gdf.to_crs({'init': 'epsg:3395'})

# note that coordinates for all text annotations have to be updated to the adopted CRS. It's easy to do that if axis isn't turned off and by trial and error.
The result was promising (I used Stamen.TonerBackground option)…
…but needed additional work as I wanted to accurately understand different CRS before using any transformations.
Next attempt
I’d have liked to create an inset map to expand on crowded contexts (Bihar, Delhi in this scenario) which makes it easier for text annotations.

It seems an interesting enough problem for better narration.
References
- Python script to draw day-wise maps, Gist
- Contextily, tiles for matplotlib maps, GitHub
- Geopandas, matplotlib
- EPSG:3395 vs EPSG:3857 projection systems, gis stackexchange