August - Gramex Charts
We made Gramex Charts open for public use. It lets you update charts from the UI and provides an option to export chart as a PNG, SVG or as code. Designers can import SVG into Sketch and make further chagnes. Try it out!
July - Solr, Tableau
I wrote about the challenges in connecting Tableau to Apache Solr as a live connection and subsequently making an extract connection via sqlalchemy-solr.
I updated my blog layout to add pagination for posts and wrote about it.
Post that I attempted to add comments for posts via staticman but failed to integrate successfully. I’ll attempt again in few months.
June - Raspberry Pi
I got my hands on Raspberry Pi and wrote about using it as Pi-hole.
16th May - Google Mobility Data for India
I looked at Google Mobility data for India which reports pre and post Covid-19 activity levels for different areas.
4th March - Annual Leadership Summit
I attended my third annual Gramener leadership summit and wrote about it.
10th February - Hyderabad Libraries, Joyful Data
I wrote about visting libaries in Hyderabad.
Joyful Data is a creative way to make data-driven graphics. I wrote on my experience using it.
5th February - Posts
I wrote about team communication and mapping family travels.
24th January - Women protests map
I created a map highlighting women-led protests against NRC/NPR/CAA in India. Featured in Behan Box article. I tried Datawrapper map this time which turned out to be easy to use. Data can have multiple entries for a single city/state combination. Using addresses to map in Datawrapper will only retain the latest entry for a city/state that has multiple entries. Using Latitude/Longitude is a better option to address it.
21st January - Data art
I wrote about data art!
15th January - Gifts
I wrote a new post on gifts!
13th January - Comics workshop @ Bangalore
We organized a data comics workshop in Bangalore on 11th Jan. Grofers graciously offered venue for the event. With 64 participants attending the workshop, we had fun organizing and viewing everyone’s work. Blog post soon!
3rd January - 2019 review
I reviewed how my 2019 went.
1st January 2020 - Break
He’ll be away from Gramener for three months (Jan to Mar 2020) to focus on curating food recipes.
December 2019 - Data storytelling events
Completed organizing eight monthly data storytelling events (Hackathons/Workshops) (meetup). What started as an internal event now extends to external participants. Browse #datastoryday or #comicsworkshop on Twitter.
October 2019 - Blog update
I replicated my writings at Gramener blog to a separate space on my GitHub pages.
January 2018 - Switching roles
After year and half of building products, he switched to creating client-facing visual solutions in late Jan 2018.
30 October 2017 - TB Burden
Short visual on TB burden in India using Vidya Krishnan’s article.
August 2016 - Gramener
Inspired by the work of Anand, he joins Gramener in late 2016 in the product team. Work involved contributions to Autolysis - an auto-insight generator, CRUD edits (FormHandler) for Gramex FormHandler.
Brief postdoc
Quit postdoc at University of Wisconsin, Madison after 4 months in mid-June 2016. He was involved in understanding functional significance of relations between genes and transcription factors.
Bhanu completes Ph.D. - December 2015
Nature Scientific Reports - August 2015
Our work, miRegulome: a knowledge-base of miRNA regulomics and analysis, is accepted in Nature Scientific Reports. To read, visit the page.
BMC Genomics - May 2015
Our work, DISMIRA: Prioritization of disease candidates in miRNA-disease associations based on maximum weighted matching inference model and motif-based analysis, is accepted in BMC Genomics. Read here.
Gender in Politics - (15th April 2015)
Gender in Politics - An initiative to analyze women participation in Indian politics is underway. In collaboration with @bhanupriyarao.
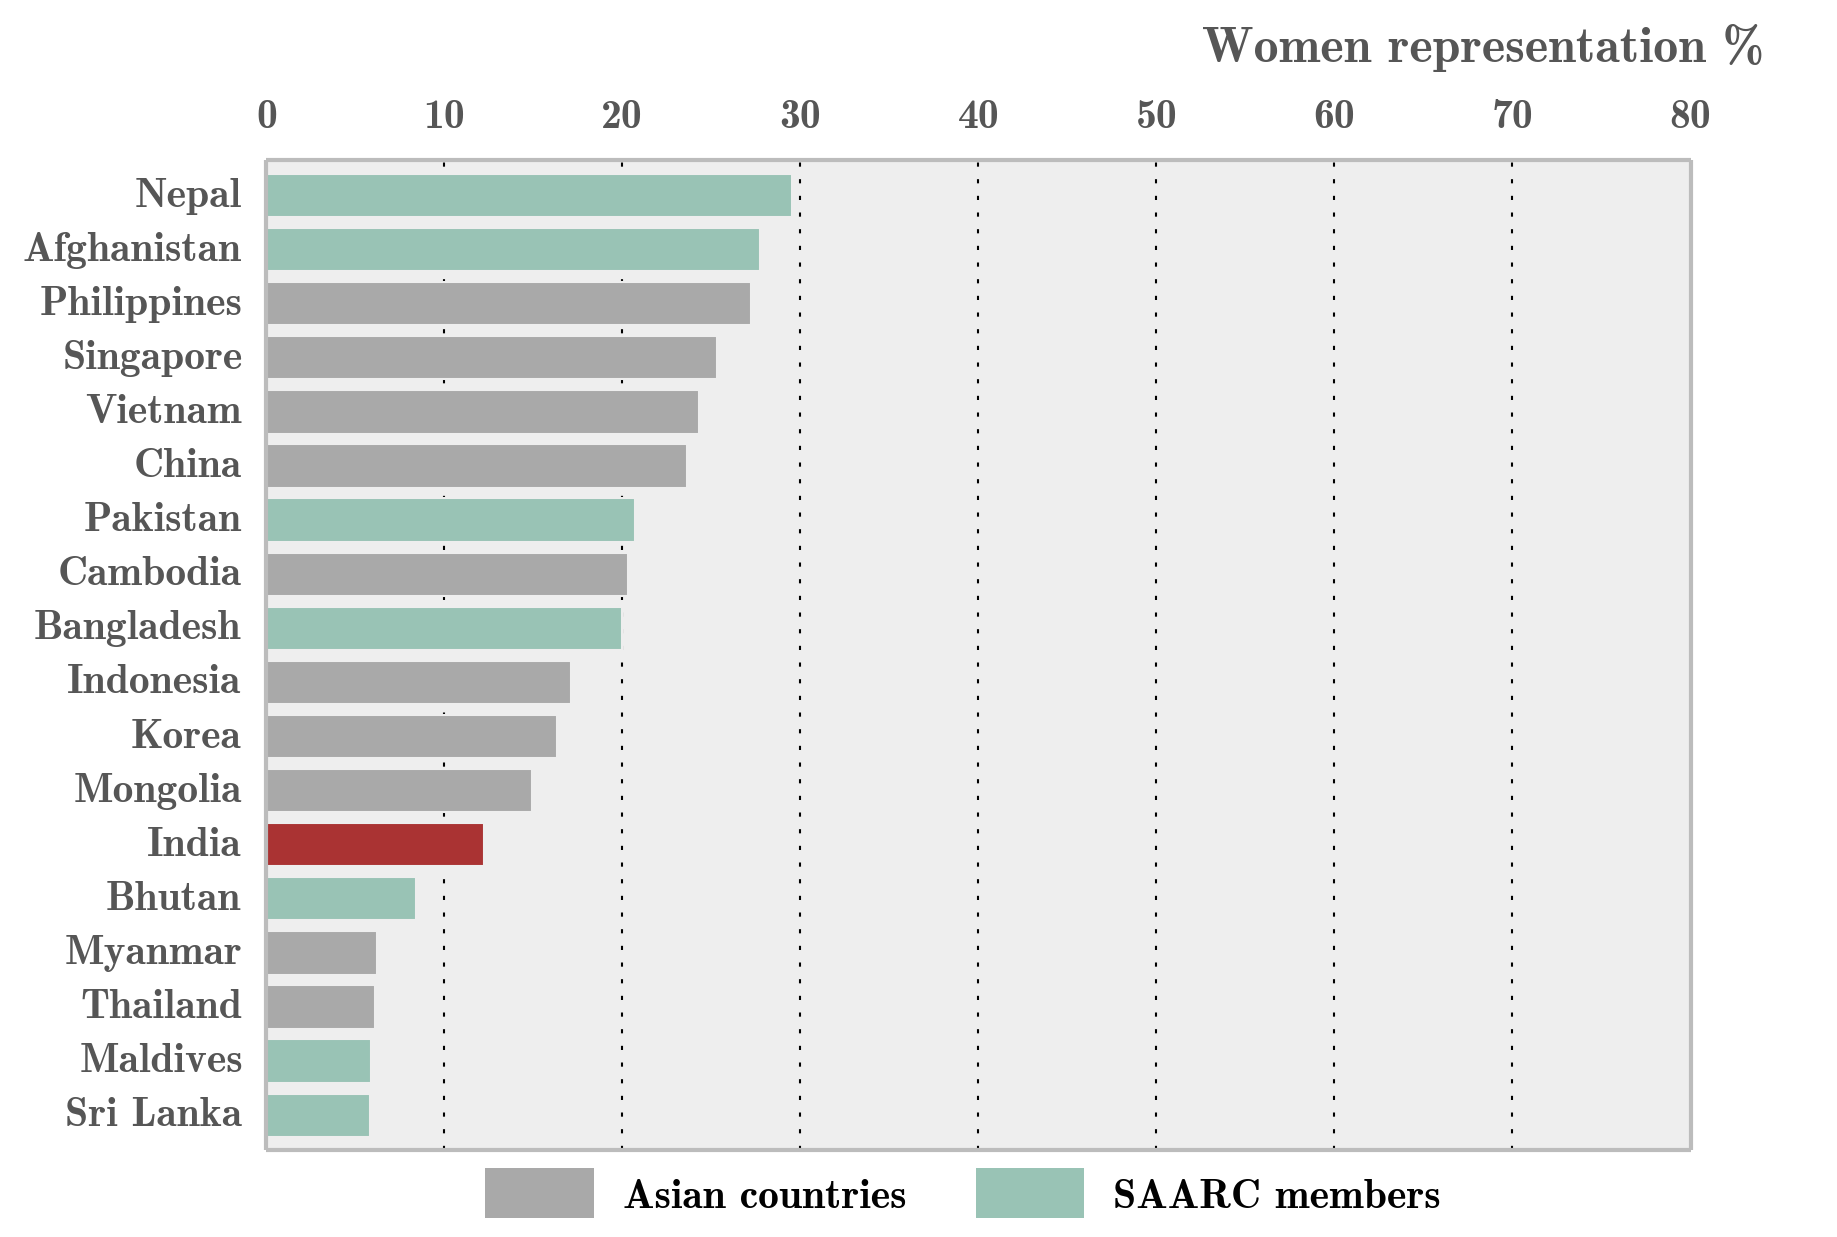
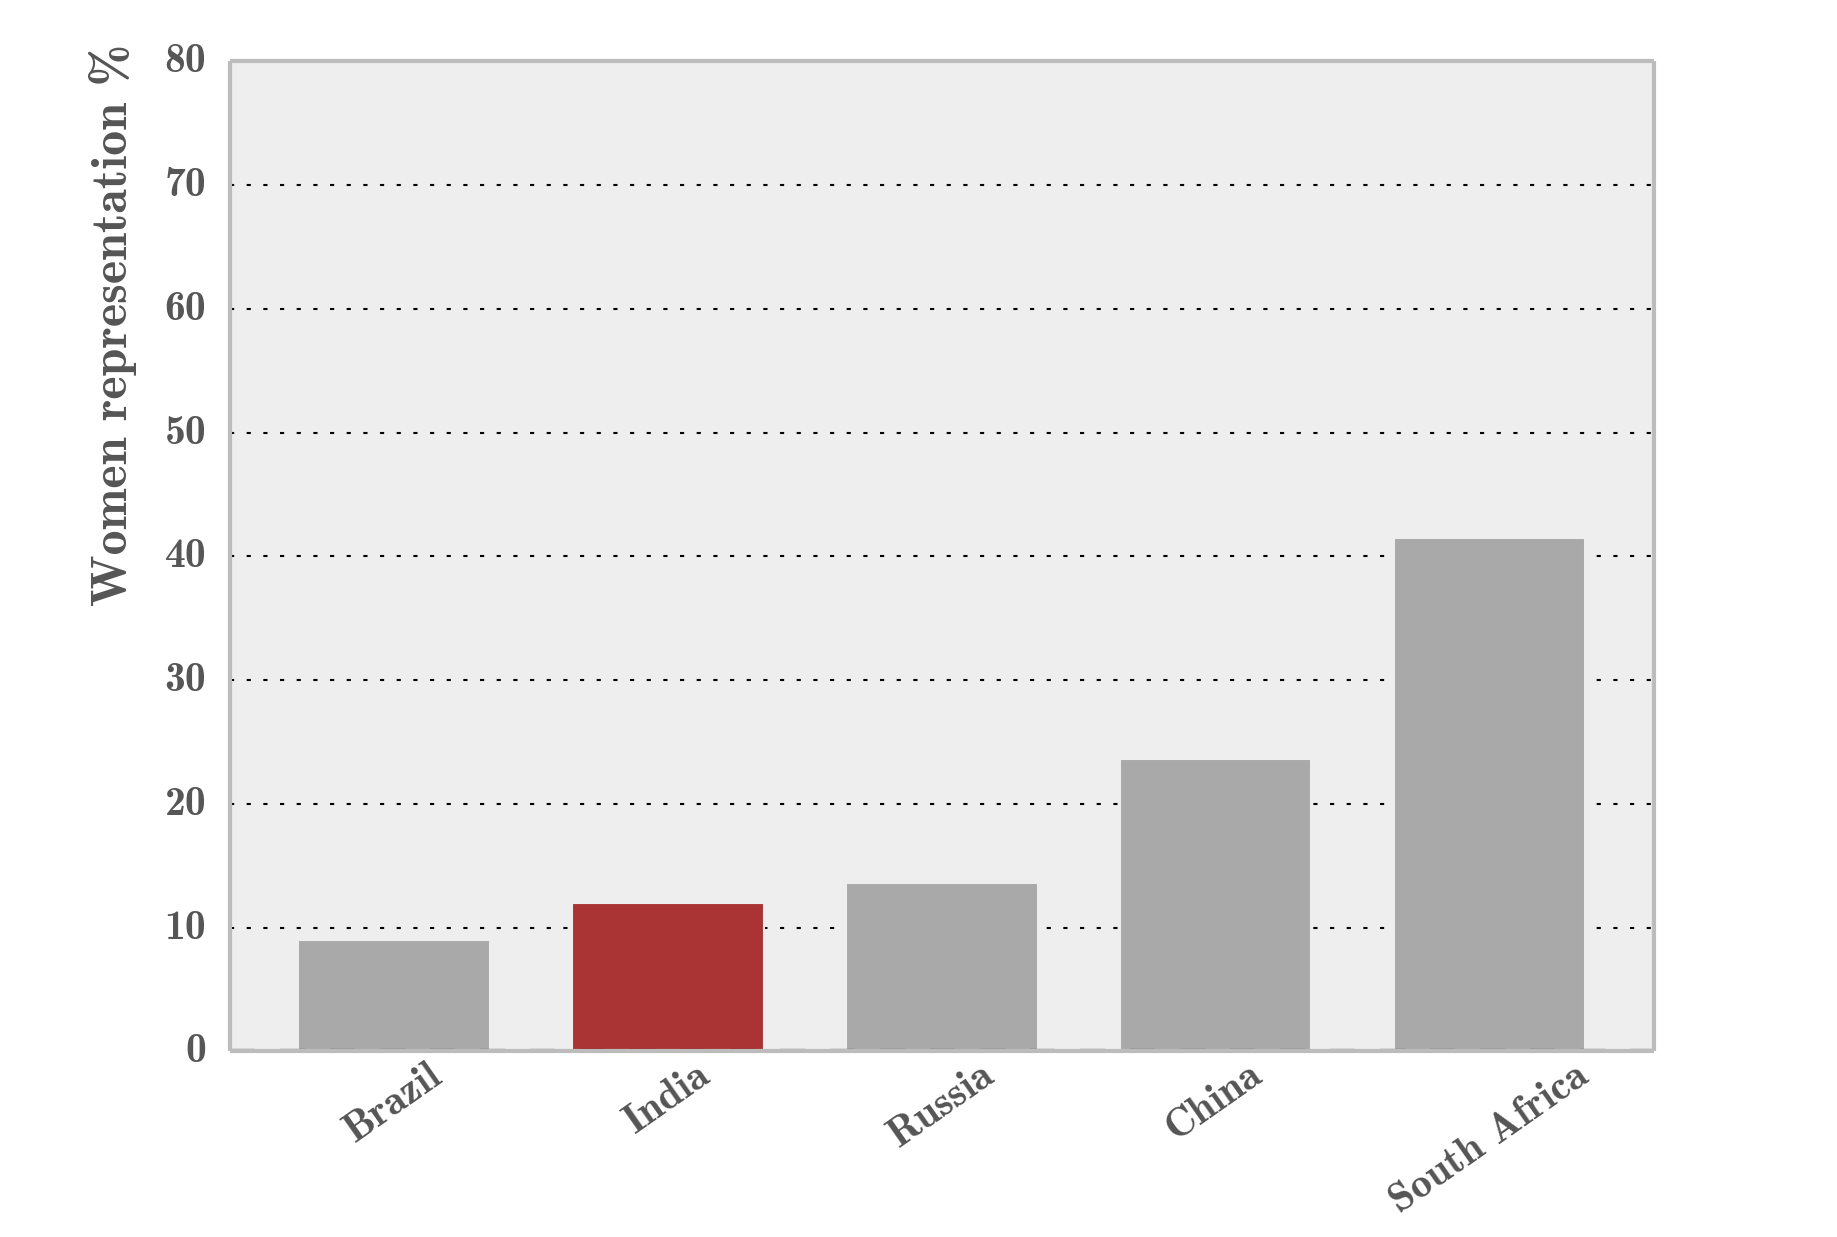
7th March 2015
Women in Parliament: Where does India figure among the rest of the World? With @bhanupriyarao.
16th February 2015
Contributed visualizations to As Arvind Kejriwal’s cabinet meets in Delhi, the one thing that makes AAP’s government just like any other. Authored by @bhanupriyarao. Images have been recolored in the article. Original images are presented below with overlaid text.
North/East/Central/South/West/Northeast in first two charts represent regions in India.